Resonance/SPOT-AIS
A human mobility analytics platform, and the product that taught it what to be.
A human mobility analytics platform, and the product that taught it what to be.
Zebra and quagga mussels move between lakes on the bottoms of boats. Once they're in a waterbody they're effectively impossible to remove, and they wreck the ecology and the infrastructure of every reservoir they reach. The defense is watercraft inspection stations: places where a state agency stops trailered boats, looks at the hull, and decontaminates if needed. The defense only works if the stations are in the right places.
Lake Powell, on the Utah-Arizona border, has a known infestation. Boats leave Lake Powell and travel hundreds of miles to other reservoirs every weekend. The state programs trying to interdict that traffic knew it was happening. They couldn't show it.
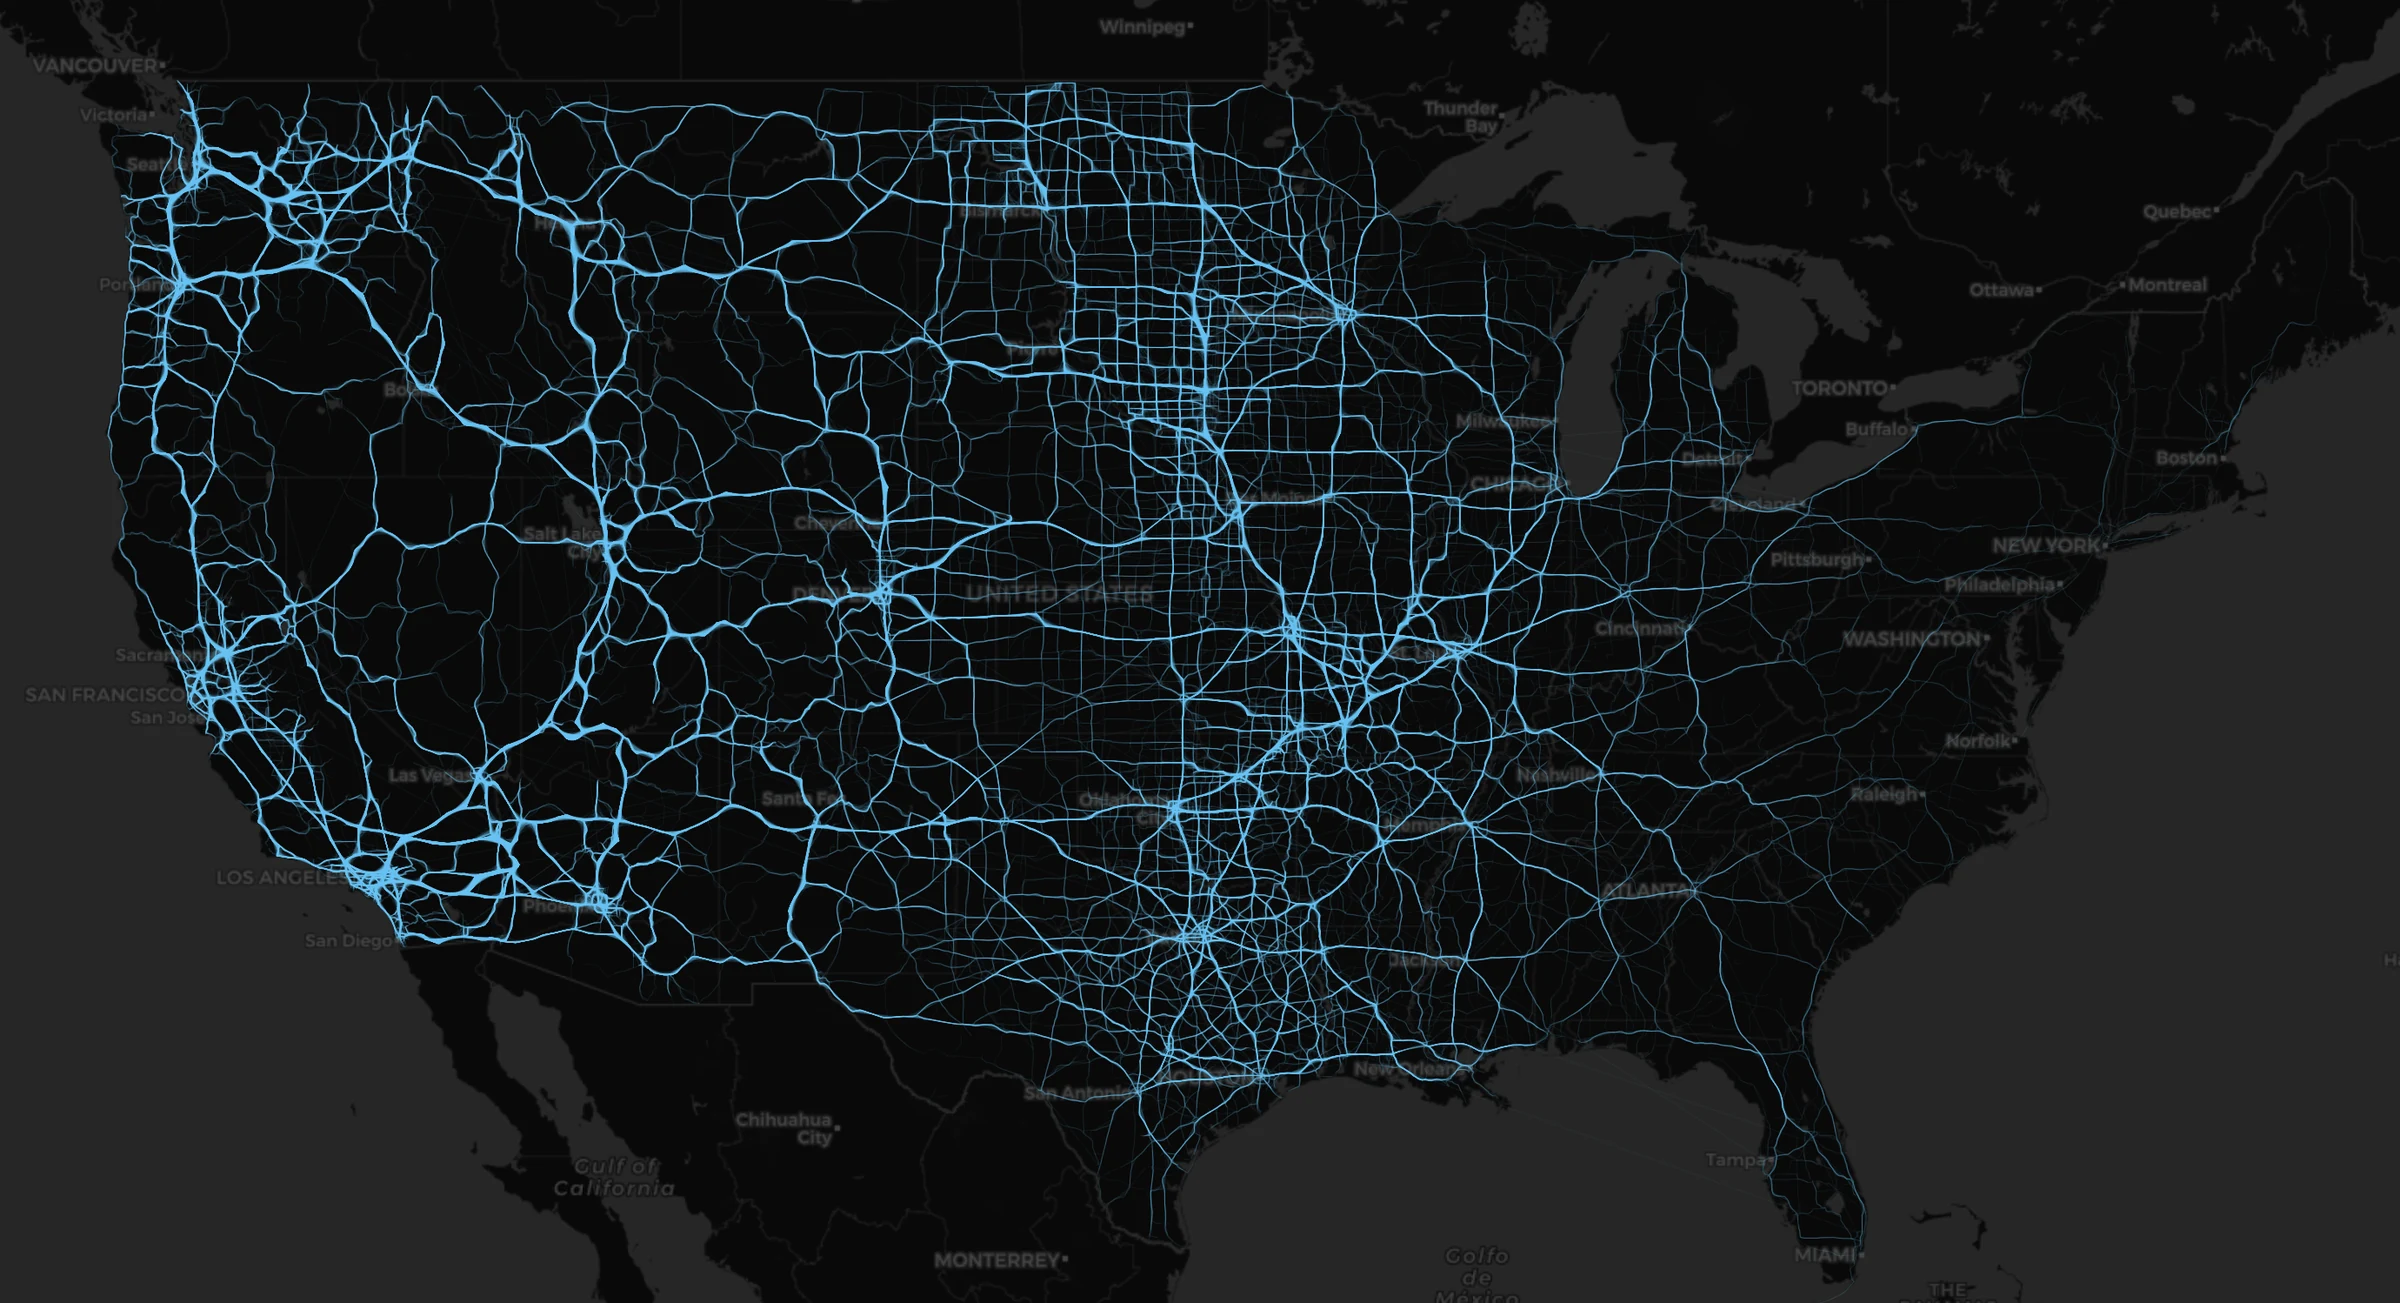
SPOT-AIS, the Station Placement and Optimization Tool, is what gives them eyes. It's a web application that visualizes lake-to-lake boater movement across roughly 21,000 U.S. waterbodies. Around 100 users (state aquatic invasive species program managers and U.S. Army Corps of Engineers staff) sign in to look at where boats are coming from, where they're going, and where they aren't being inspected on the way. One of them, a state program manager, used SPOT-AIS to identify a stretch of road where Lake Powell traffic was entering his state uninspected. He took the visualization to his state government as evidence and made the funding case for a new inspection station on that corridor. That is the work this product is for.
SPOT-AIS is one product. Resonance is the platform underneath it.
I didn't set out to build a platform. The work started as a series of one-off reports on a monthly sprint cycle: talk with the client, go back to the data, produce a deck, present it, get feedback, repeat. The questions kept multiplying. Can you filter by weekend? Can you split day from night? What about just the after-hours traffic? At some point I realized the bottleneck wasn't analytical. It was the turnaround time between a new question and a new answer. Every permutation cost us a sprint.
The fix was to let the user ask their own questions: an interactive map where the filtering happens client-side, in real time, with the analytical work pre-computed behind it. That's what SPOT-AIS became.
When a second client arrived (different domain, different filters, different map semantics, same underlying problem of a stakeholder who needs to ask many questions of one dataset and can't wait a month between asks) the shape was already familiar. That recognition is what turned the work from a product into the seed of a platform. Resonance is the abstraction that fell out of doing this work twice and noticing the same scaffolding both times. The platform now runs production deployments across federal, commercial, and municipal clients. Adding a tenant is closer to a configuration exercise than a new build.
Getting signal out of noisy data. Raw GPS pings from a commercial location data vendor are dense, jittery, and full of holes. A phone at rest reports the same coordinate dozens of times with small arbitrary offsets. A device entering a parking garage drops off the network for an hour. A device occasionally reports an erroneous speed that no real vehicle could be moving at. Extracting meaningful movement out of that takes a layered cleanup: inferring where a device sleeps, classifying its visits to known places, snapping its trips to the road network, and cleaning out the trajectories that don't pass muster. None of the steps is independent. Change the criteria for inferring a home location and you cascade through every downstream step: which devices stay eligible, which trajectories survive cleanup, which counts drive the heatmap. The pipeline is a tuned system, and the tuning is most of the work.
Sub-second interaction at scale. The platform serves filterable heatmaps over partitioned tables that hold tens of millions of rows per tenant, and trajectory layers that hold hundreds of thousands of LineStrings. The interaction target is under a second across arbitrary filter combinations. The system gets there through a dual-format strategy: static immutable layers ship as PMTiles archives served as byte-range requests, dynamic filterable layers stay as live PostgreSQL queries served through the Martin tile server. The zoom level steps the spatial resolution, so the system aggregates more aggressively when the user is zoomed out. The database has precomputed polygon tables for every H3 resolution the map will ever request, because the managed Postgres deployment can't install the H3 extension; we shifted that computation upstream to Databricks where the compute is. The architecture got here by being wrong first. The earliest version leaned on edge caching as the main performance story, and it worked until it didn't, at which point we had to measure where the latency actually lived rather than where we'd assumed it was. The current stack is what we have after several rounds of measuring honestly.
Privacy at the trajectory layer. Heatmap products aggregate by hexagonal cell, and aggregation is the privacy story: a cell either has enough devices to display or it doesn't, and a minimum-count threshold can be enforced cleanly. Trajectory products are different. The whole value of a trajectory product is the visible line between origin and destination, and a line is made of vertices, and aggregation against vertices changes what the user can see. Resonance handles the two cases as different products with different postures. Heatmap tiles enforce the minimum-count threshold per cell at the data layer, so any cell that falls below it never reaches the wire. Trajectory products sit behind authenticated, audited access, with rendering constraints that prevent the geometry from being inspected at scales where individual movement would become legible. The vendor data arrives pseudonymized; the platform's controls sit on top of that, not as a substitute for it.
The biggest shift is that the interface is part of the analysis. I came into this work thinking of my deliverables as the maps, reports, and dashboards that get assembled inside someone else's framework: ArcGIS, Tableau, Esri Experience Builder. Resonance taught me that the shape of how a user interacts with data is a design decision as consequential as which model is fit or which thresholds get used to filter the data. Once you can build the interface yourself, the ceiling on what a data project can be moves up. The state program manager who took SPOT-AIS to his legislature didn't need a better statistic. He needed to be able to show his audience a map they could read in five seconds. The analysis underneath that map is real and intricate. The map is also the product.
The discourse around LLM-assisted coding has polarized into "vibe coding" on one side and skepticism on the other, and neither captures what the work actually looks like. A substantial fraction of the implementation on Resonance was written by LLM-assisted coding tools, which I've been working with since 2023. The architecture, the data model, the serving strategy, the privacy posture, and the product calls are mine. The line-by-line code is often the model's. The discipline that makes that productive is knowing which decisions you're keeping and which you're delegating, and noticing when the model is about to make a decision that should have been yours. The model's failure mode isn't bad syntax. It's quietly substituting an easier adjacent problem for the one you actually asked about, and producing clean code for the wrong thing. Catching that is a skill, and it's a different skill than writing the code yourself. It's closer to technical editing than to authorship: you set the structure, you read what gets drafted against the structure, you intervene where the drafting diverges from the intent. Resonance is the project where I learned what that practice actually demands at the scale of a real platform. It demands more architectural clarity, not less, because the model needs a frame to work inside, and the frame is what you bring.
Each new tenant changes the platform. The trajectory privacy posture got sharper because of SPOT-AIS. The dual-format tile-serving strategy got built because two tenants in a row outgrew the previous performance ceiling. The frontend module system exists because three deployments made the duplication impossible to ignore. Platforms find their shape this way: a plan gets you the first version, deployments get you the rest.